A new international research with the AgrImOnIA dataset
A new paper has been published on arXiv about the statistical modelling of environmental risks using the AgrImOnIA dataset.
New international research with the AgrImOnIA dataset
The main aim of the paper (link) by Philipp Otto and colleagues is to introduce a novel statistical model called the dynamic spatiotemporal stochastic volatility (SV) model. It includes explicit terms for the spatial, temporal, and spatiotemporal spillover effects and time-invariant site-specific constant log-volatility terms. Thus, this formulation allows distinguishing between spatial and temporal interactions, while each location may have a different volatility level.
Even though there are only a few empirical studies on environmental risks, previous literature undoubtedly demonstrated the importance of climate variation studies. For example, for local air quality in Northern Italy in 2021, we show pronounced spatial and temporal spillovers and larger uncertainties/risks during the winter season compared to the summer season.
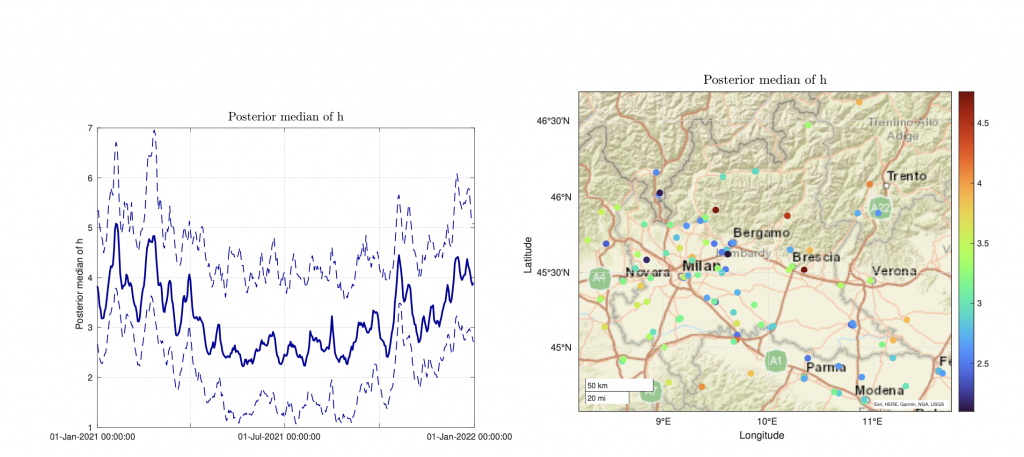
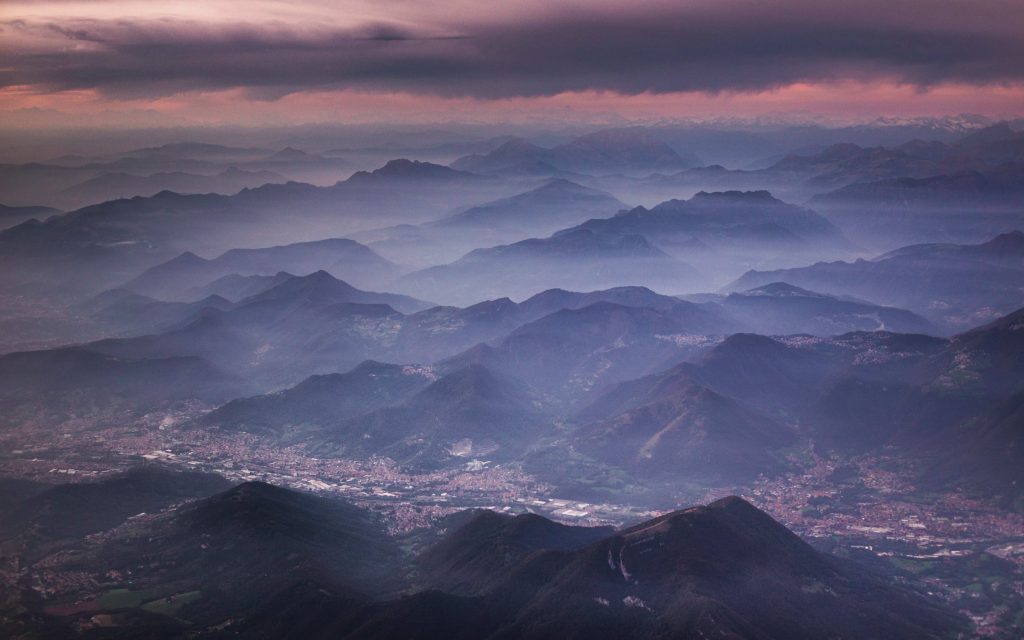
As for applications in financial economics, the volatility of the process can be interpreted as risks (i.e., environmental risks in our case). Previous ecological studies primarily focused on changes in the mean behaviour, but also an increased variation might be harmful, e.g., an increased temperature variation (i.e., changes in the variance) poses a greater risk than global warming (i.e., changes in the mean). For visualisation in the Figure below, we computed the median and the 5% and 95% quantiles of the Bayesian estimates across all spatial locations (see time series plot) and across all time points (see map). From the time series plot, we see that there is a clear annual pattern – the model uncertainties are lower in summer and highest in winter. These varying conditional volatility levels can be interpreted as environmental risks, which are the highest in the winter season. In the same manner, measurement stations with a greater uncertainty/risk can be identified from the map. They are mostly located in valleys in mountain areas.
The paper is available from the ArXiv repository and can be downloaded at https://arxiv.org/abs/2211.03178